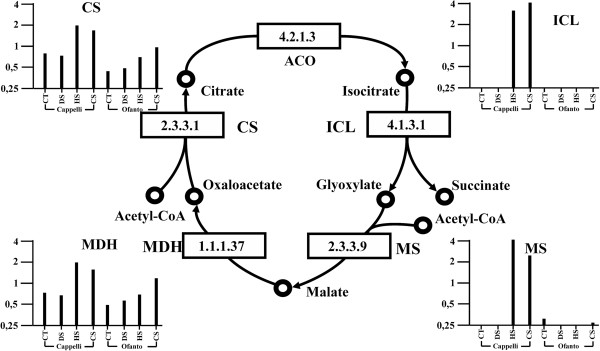
Figure 5.

Representation of the glyoxylate pathway: variations in the expression levels of the genes coding for the key enzymes. The four treatment conditions, grouped by genotypes, are plotted on x axis. The relative expression level (data normalized to the median for each probe set) is plotted on the y axis. ACO: aconitase (EC 4.2.1.3). CS: citrate synthase (EC 2.3.3.1); ICL: isocitrate lyase (EC 4.1.3.1); MDH: malate dehydrogenase (EC 1.1.1.37); MS: malate syntase (EC 2.3.3.9). CT = Control samples; DS = Drought stressed samples; HS = Heat stressed samples; CS = Combined stress samples.
