
Figure 7.
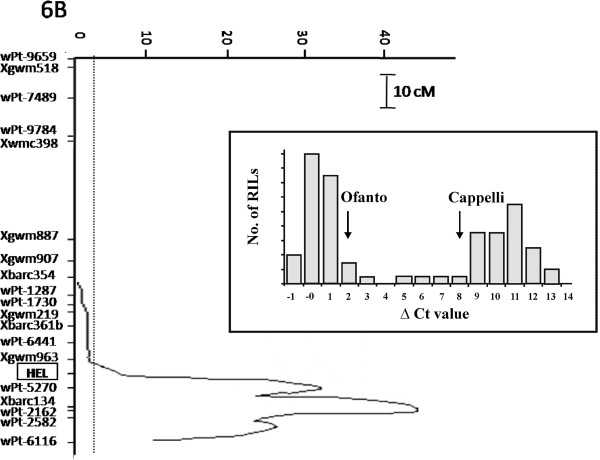
Partial genetic map of the region of the durum wheat chromosome 6B (long arm) carrying the HEL locus, the major QTL controlling HEL expression level and the corresponding curve of LOD values. The insert reports the frequency distribution of ∆Ct values of HEL expression detected in 80 RILs deriving from the cross between Ofanto and Cappelli and subjected to drought stress (tillering stage) determined by a relative soil water content (RSWC) of 27-28%.