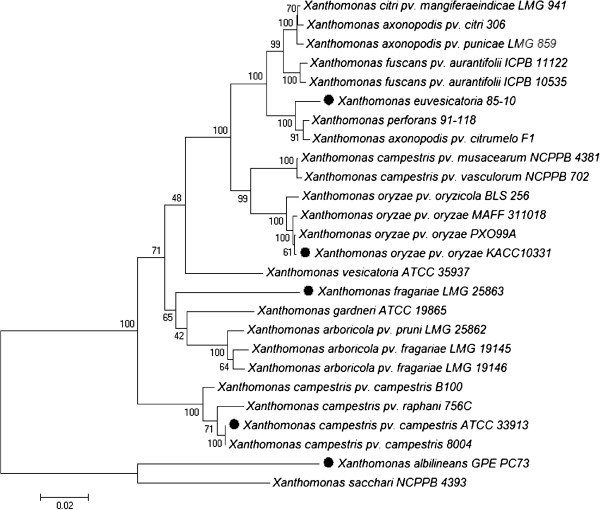
Figure 2.

Relationship among 26 Xanthomonas genomes. Phylogenetic relationship among the 26 available Xanthomonas genomes based on the concatenation of partial gene sequences of gyrB, rpoD, atpD, dnaK and fyuA (in total about 3788 nucleotides per strain). The tree was generated with Mega 5 software using the Neighbour Joining algorithm with 1,000 bootstrap replicates. Bootstrap support for the groups is represented on the tree at the different nodes. Branch length is proportional to divergence, the 0.02 scale represents 2% difference. The 5 genomes used in the EDGAR comparative genome analysis are indicated by black circles (●).
