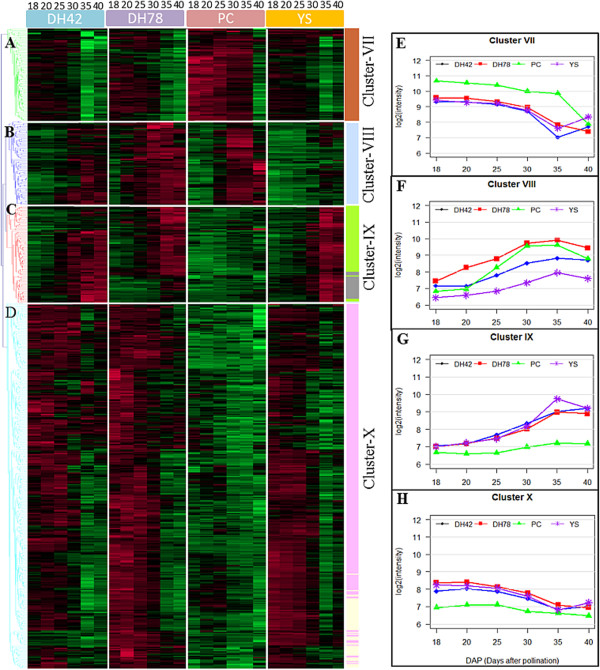
Figure 7.

Characteristics of transcriptional patterns in seed development stages (18 – 40 DAP) showing genotypic and temporal variation. A-D Hierarchical clustering (Euclidean distance, average linkage) on 555 probes from six WGCNA gene modules with both a genotype and time effect. Vertical white bars separate genotype and horizontal white bars separate cluster of genes. Colours of dendrogram branches indicate different clusters of genes while the colour bar on the right side indicates WGCNA gene modules. Red indicates high, green low, black an intermediate level of transcript abundance. E-H mean abundance of transcripts on four genotypes (YS143, PC175, DH42 and DH78) representing gene clusters A-D respectively.
