
Figure 3.
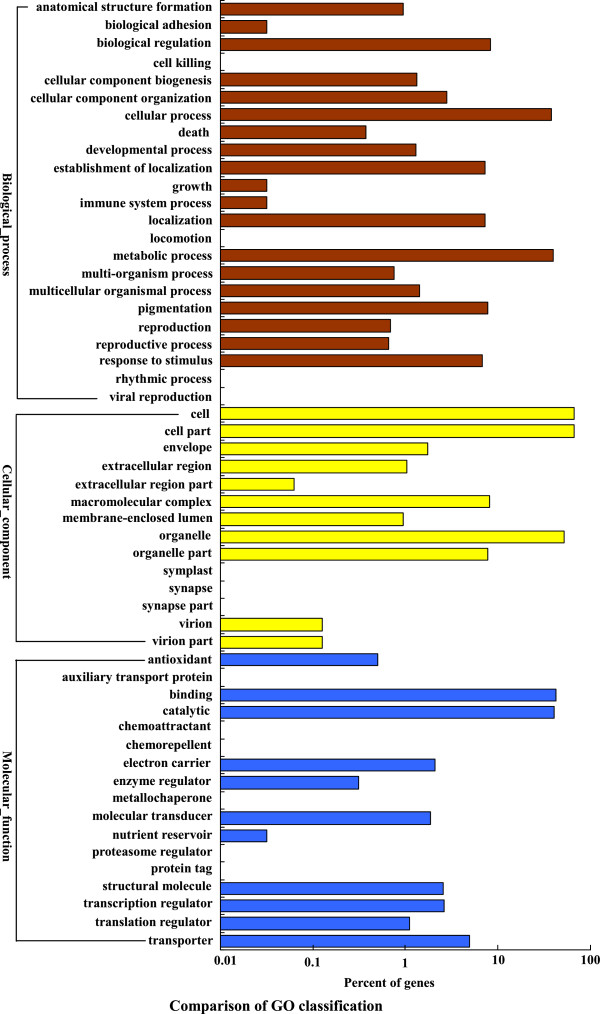
Histogram of Gene Ontology (GO) classifications. Biological process (brown), Cellular components (yellow) and Molecular function (blue). Percentages indicate the proportion of unigenes that have GO annotations.
Official websites use .gov
A
.gov website belongs to an official
government organization in the United States.
Secure .gov websites use HTTPS
A lock (
) or https:// means you've safely
connected to the .gov website. Share sensitive
information only on official, secure websites.
Histogram of Gene Ontology (GO) classifications. Biological process (brown), Cellular components (yellow) and Molecular function (blue). Percentages indicate the proportion of unigenes that have GO annotations.