
Figure 5.
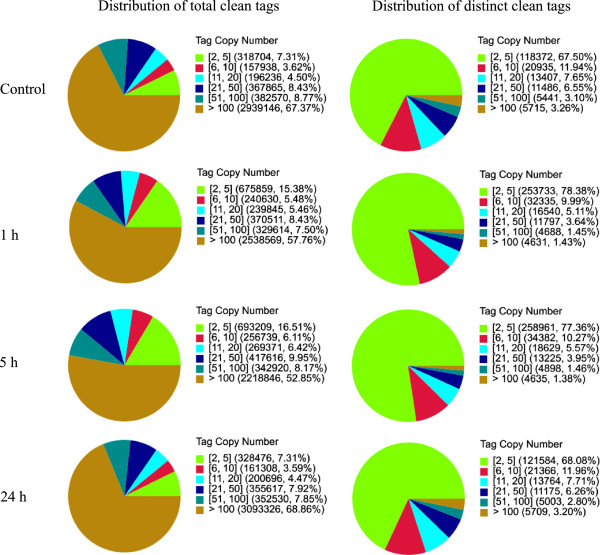
Distribution of total tags and distinct tags of DGE sequencing. The left figure is the distribution of total tag number, and the right figure is the distribution of distinct clean tags. Numbers in the brackets indicates the range of copy numbers.