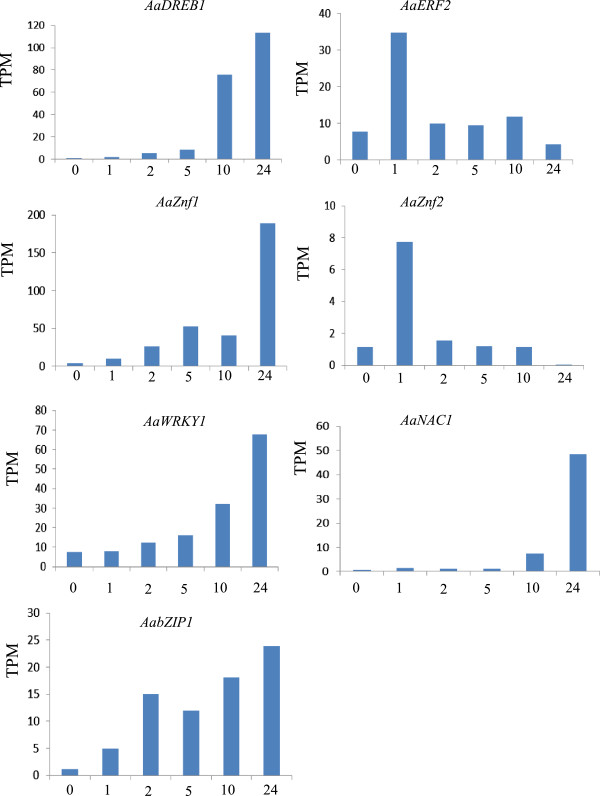
Figure 7.

Analysis of differentially expressed transcription factor genes in Anthurium under low temperature. The gene expression levels were determined by calculating the number of unambiguous tags for each gene and then normalized to TPM (transcript copies per million tags).
