
Figure 2.
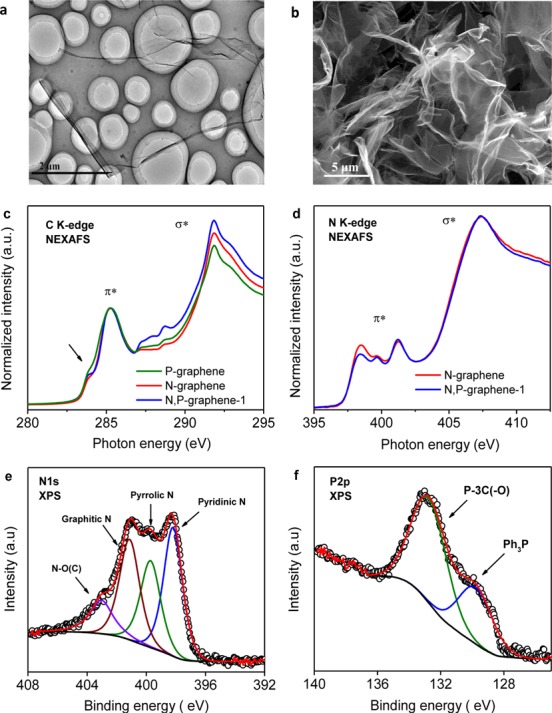
(a, b) TEM and SEM images of N,P-graphene-1 nanosheets. (c, d) C and N K-edge NEXAFS spectra of N- and/or P-doped graphenes. (e, f) N 1s and P 2p high resolution XPS spectra of N,P-graphene-1. In panel e, four nitrogen binding configurations represent pyridinic-, pyrrolic-, and graphitic-N species (B.E. = 398.2, 399.7, 401.2 eV) and oxidative N–O(−C) species (B.E. = 403.0 eV).14 In panel f, two phosphorus binding configurations represent P–3C(−O) species (B.E. = 132.9 eV) in the basal plane of graphene and a small amount of P–C species (B.E. = 129.9 eV) remaining from precursor.15