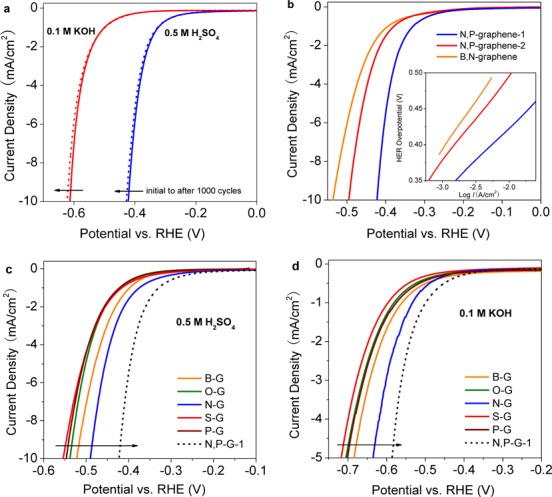
Figure 4.

(a) Polarization curves of N,P-graphene-1 recorded before and after 1000 potential sweeps (+0.2 to −0.6 V vs RHE) in acidic and alkaline solutions, respectively. (b) Comparison of the polarization curves and Tafel plots (inset) of one-step synthesized N,P-graphene-1 versus two-step synthesized N,P-graphene-2 as well as B,N-graphene10 in 0.5 M H2SO4 solution. (c, d) HER polarization curves of different single-doped graphene catalysts as compared to that of dual-doped graphene in both acid and base solutions.
