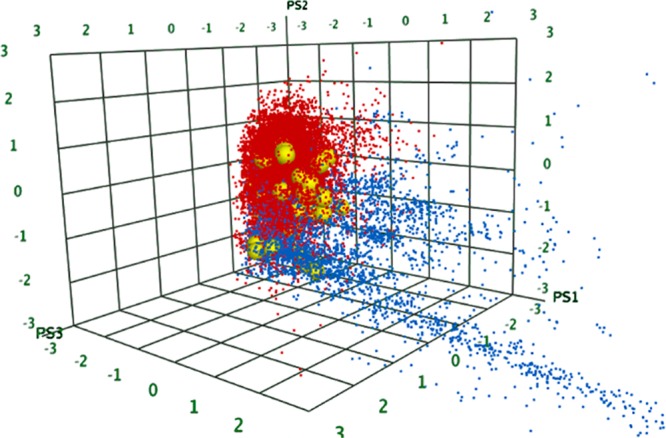
Figure 5.

PCA mapping of different libraries. Subset of Asinex screening library (red), Analyticon NP library (blue), and the SB compounds (yellow). The three axes represent the three first principal components as generated by the ChemGPS-NP webserver.
