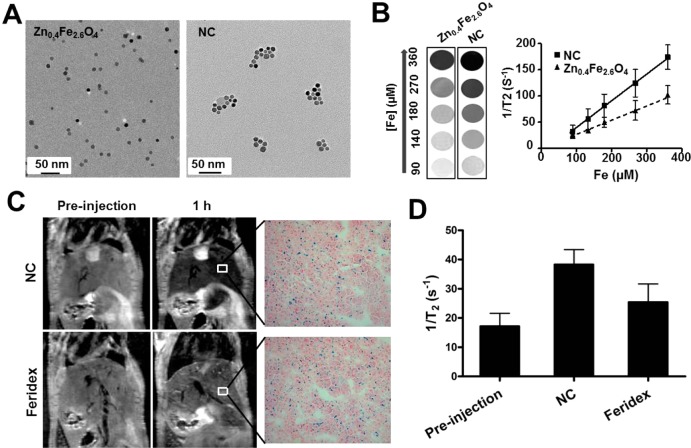
Figure 3.
Nanocluster improves T2 contrast effect. (A) TEM images of discrete Zn0.4Fe2.6O4 MNPs and HA–Zn0.4Fe2.6O4 NC. (B) T2*-weighted phantom images of Zn0.4Fe2.6O4 MNPs and HA–Zn0.4Fe2.6O4 NC at different iron concentrations. (C) Comparison of 1/T2 (r2) values of MNPs in the liver of mice using MR imaging. After injection of the same dose of MNPs (0.56 mg/kg iron), liver uptake of MNPs was evaluated by Prussian blue staining. (D) Quantitative analysis of 1/T2 values of HA–Zn0.4Fe2.6O4 NC and Feridex in liver (n = 3).

