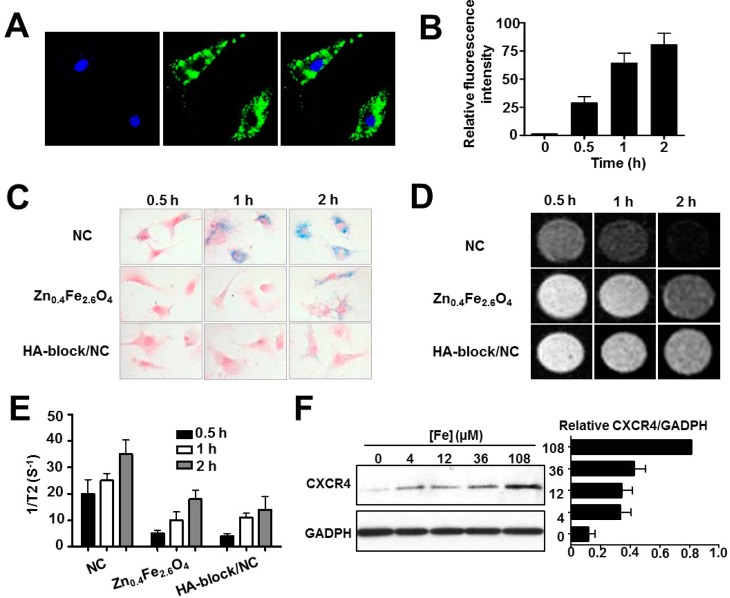
Figure 4.
Enhanced cellular uptake and CXCR4 expression in HA–Zn0.4Fe2.6O4 NC-labeled MSCs. (A) Confocal images of HA–Zn0.4Fe2.6O4 NC cellular uptake after 2 h incubation. (B) FACS analysis of HA–Zn0.4Fe2.6O4 NC cellular uptake. The MSCs were incubated with FITC-NC for the indicated time periods. (C) Cellular uptake was evaluated by Prussian blue staining. (D,E) T2*-weighted images and quantitative analysis of cellular uptake at the same cell concentration. (F) Western blot analysis of CXCR4 expression in HA–Zn0.4Fe2.6O4 NC-labeled MSCs.

