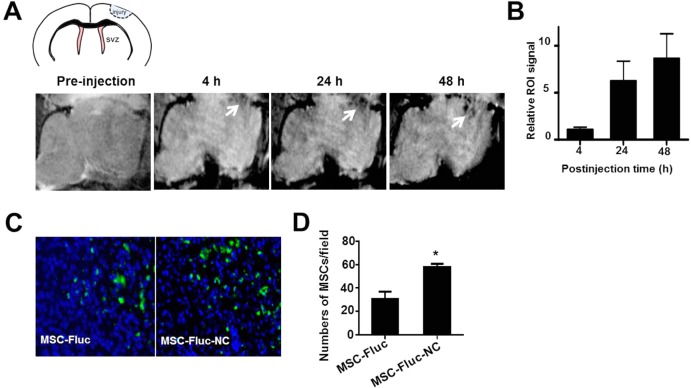
Figure 6.
In vivo imaging of targeted delivery of MSCs to TBI site after intravenous injection. (A) In vivo MR images of the delivery of HA–Zn0.4Fe2.6O4 NC-labeled MSCs to the injury site (arrow). MSCs (1 × 10⁶) were incubated with and without particles for 2 h, then collected and injected intravenously to TBI mice. MR images were acquired on a 7 T small animal MRI scanner. (B) Region of interest analysis of the TBI site pre- and postinjection of delivery of NC-labeled MSCs. (C) Immunofluorescence staining of frozen brain tissue slices for Fluc at 48 h after intravenous injection of 1 × 10⁶ MSC-Fluc cells. Representative images of MSC-Fluc and MSC-Fluc-NC in injury sites. (D) Quantitative analysis of Fluc-positive MSCs by randomly selected fields in (C) (*p < 0.05).

