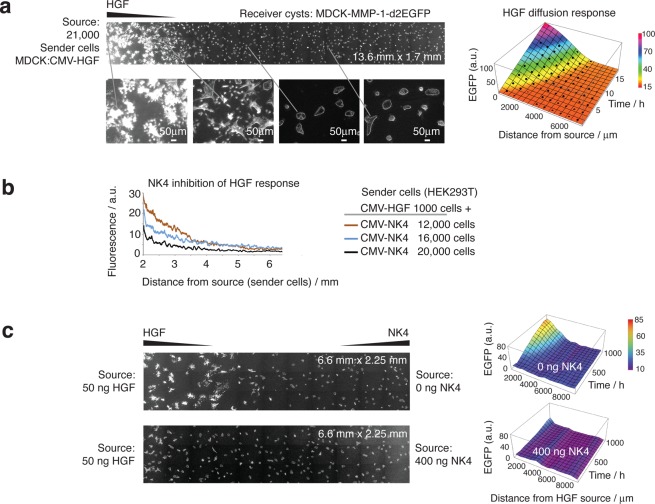
Figure 6.
Sender cell regions produce gradients of HGF-induced and NK4-repressed fluorescence in collagen matrices containing MDCK-MMP-1-d2EGFP receiver cysts. (a) A widefield view of the receiver region next to a well (not shown) containing 21 000 MDCK sender cells (transfected with CMV-HGF-IRES-dsRED and sorted by FACS for dsRED). The composite image is stitched from multiple 752 × 599 mm images and shows the fluorescence and tubulation of the cysts at time point 16.5 h, with close-up views in the insets below. Timelapse data were thus collected and used to obtain the diffusion gradient response profile over time (right). Average intensity values at particular spatial points (black dots) were used to fit the diffusion model shown by the color axis surface profile (see Supporting Information for diffusion constant calculations). (b) Quantification of NK4 repression of HGF-induced GFP gradients from mixtures of transfected HEK293T sender cells added to single sender wells (HEK293T were used because of high transfection efficiency). Sender cells expressed CMV-HGF-IRES-DsRed plus CMV-NK4-CBD-IRES-DsRed. Fluorescence images were quantified with ImageJ (Radial profile plugin). (c) Interaction of an HGF gradient with an NK4 gradient. Sender wells were created approximately 9 mm apart and the indicated amounts of purified HGF or NK4 were added at opposite ends, allowing diffusion over a field of reporter cysts, while taking timelapse GFP fluorescent images (images shown: 18.5 h). The images were quantitated (right; see Supporting Information) to obtain response profiles over time, showing that NK4 restricts the HGF-induced fluorescent gradient.

