
Figure 3.
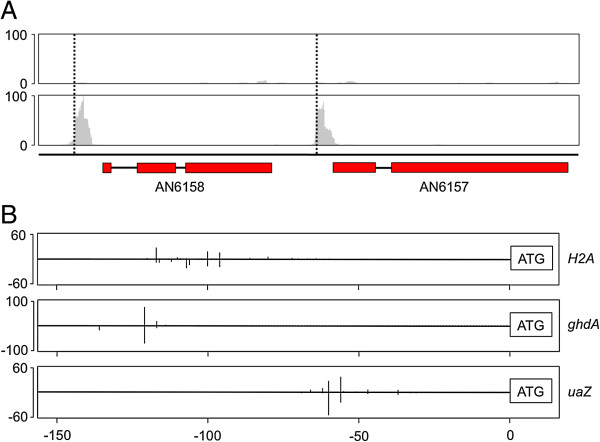
5′-specific RNA-seq locates transcription start sites. (A) Coverage depth of 5′-specific RNA-seq libraries (plotted in grey). Peaks and dotted lines indicate the transcription start sites of two annotated genes: AN6158 and AN6157. (B) Experimental validation of 5′-specific RNA-seq data. The x-axis indicates the distance (in base pairs) upstream of the translation initiation codon ATG for three genes: H2A.Z (AN8039), gdhA (AN4376) and uaZ (AN9470). For each gene, the proportion of RNA-seq reads starting at a given position is plotted above the line and the approximate proportion of 30–50 Sanger-sequenced plasmids containing products of circularisation RT-PCR supporting a given TSS is potted below the line.