
Figure 3.
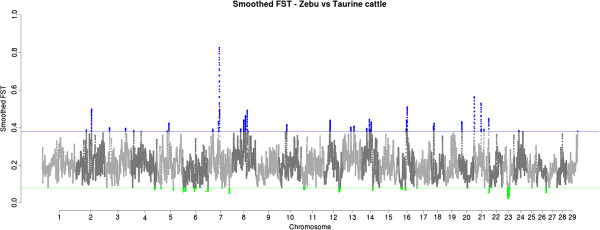
Smoothed FST comparing taurine and zebu animals. Only autosomes are plotted in alternated shades of gray. The top and bottom 1% values are highlighted in blue and green, corresponding to the regions under positive and balancing selections.
Official websites use .gov
A
.gov website belongs to an official
government organization in the United States.
Secure .gov websites use HTTPS
A lock (
) or https:// means you've safely
connected to the .gov website. Share sensitive
information only on official, secure websites.
Smoothed FST comparing taurine and zebu animals. Only autosomes are plotted in alternated shades of gray. The top and bottom 1% values are highlighted in blue and green, corresponding to the regions under positive and balancing selections.