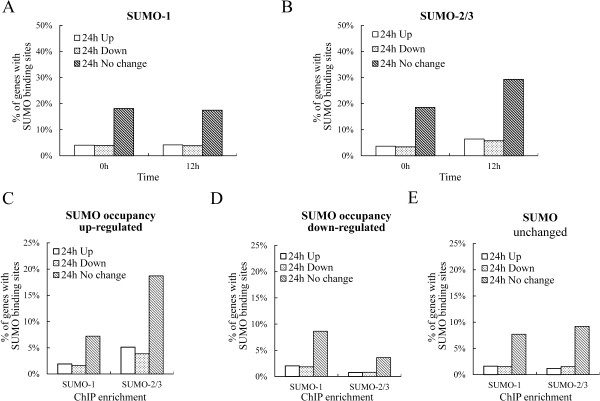
Figure 11.

The distribution of transcriptional up-regulated, down-regulated and unchanged genes has SUMO binding within their promoter region before and after viral reactivation. (A and B) Genes transcriptionally up-regulated, down-regulated and unchanged after viral reactivation were plotted against SUMO-1 (A) or SUMO-2/3 (B) occupancy on the promoter region of control (0 hr; left panel) and KSHV reactivated (12 hr; right panel) BCBL-1 cells. (C to E) Genes transcriptionally up-regulated, down-regulated and unchanged after viral reactivation were plotted against SUMO-1 (left panel) and SUMO-2/3 (right panel) occupancy that was increased (C), decreased (D) or unchanged (E) on the promoter region during KSHV reactivation. Bars represent % of transcriptionally up-regulated, down-regulated and unchanged genes with SUMO occupancy that was normalized to total transcriptionally up-regulated, down-regulated and unchanged genes during viral reactivation, respectively.
