
Figure 13.
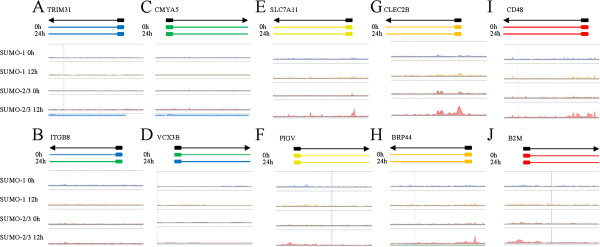
Histogram of SUMO paralogue binding sites before and after KSHV reactivation. Examples of the epigenetic features associated with no expression (A and B), low expression (C and D), medium expression (E and F), high expression (G and H), and very high expression (I and J) gene loci. No expression: blue; low expression: green; medium expression: yellow; high expression: orange; very high expression: red.