
Figure 2.
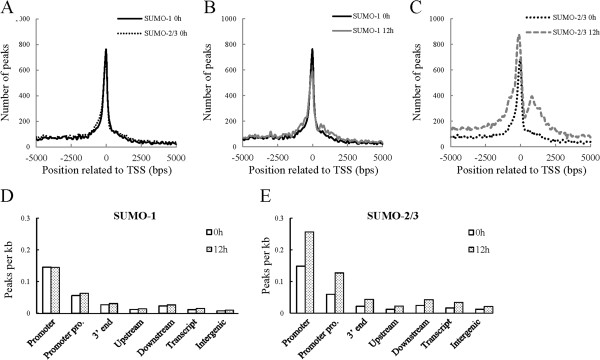
Genome-wide analysis of SUMO-1 and SUMO-2/3 binding region during KSHV reactivation. (A-C) Distance distribution of all SUMO-1 and SUMO-2/3 peaks. Distance to transcription start site (TSS) before (A) and after (B and C) K-Rta induction for viral reactivation. (D and E) Gene context of SUMO-1 (D) and SUMO-2/3 (E) binding sites during KSHV reactivation represented by peak density, after adjustment for the prevalence of gene context category in the genome. Promoter: TSS ± 500; Promoter pro. (Promoter proximal): TSS ± 2 Kb; 3′ end: TES ± 500; Upstream: -2 kb to −10 kb upstream of the TSS; Downstream: +2 kb to +10 kb downstream of the TES; Intergenic: ≥10 kb from any coding genes. TES: transcription end site.