
Figure 3.
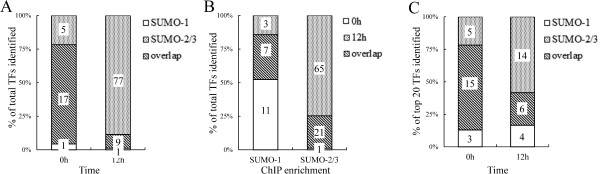
Overview of potential TFs targeting by SUMO paralogues during KSHV reactivation. (A) Percentage of overlapped TFs target sites for SUMO-1 and for SUMO-2/3 before and after K-Rta induction resulting in KSHV reactivation (B) Percentage of overlapped SUMO-1 or SUMO-2/3 target TFs before and after viral reactivation. (C) Percentage overlap of the top-20 potential TF targets for SUMO-1 and SUMO-2/3 before and after viral reactivation; numbers indicate overlapping and non-overlapping TF counts.