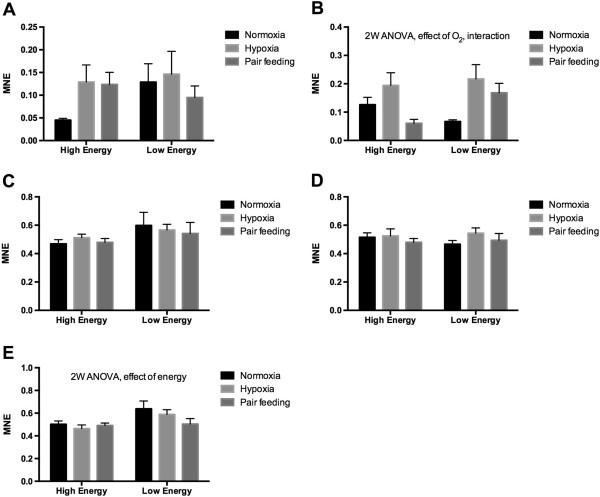
Figure 8.

Transcription of 12 genes determined with RT-qPCR from the low oxygen experiment. The data were obtained from liver of Atlantic salmon kept at normal oxygen saturation (normoxia), kept at low oxygen saturation (hypoxia), or pair fed on level with the hypoxia-exposed fish. A) IGFBP1A, B) IGFBP1B, C) MTOR, D) NDUFS1 and E) PSMC2. Each value represents the mean ± SEM (n = 9). Significant differences were identified with a 2-way ANOVA analysis. Significant effects of oxygen exposure levels, feed energy and interactions are shown in the figures. MNE = Mean Normalized Expression.
