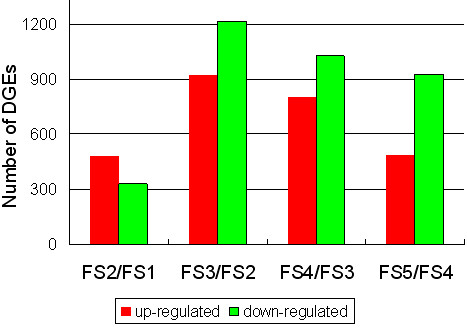
Figure 10.

Changes in gene expression profile among the different developmental stages. Unigenes up-regulated (red) and down-regulated (down) between two adjacent fruit developmental stages were quantified. DGEs: digital gene expressions, FS1: fruit stage 1, FS2: fruit stage 2, FS3: fruit stage 3, FS4: fruit stage 4, and FS5: fruit stage 5.
