
Figure 3.
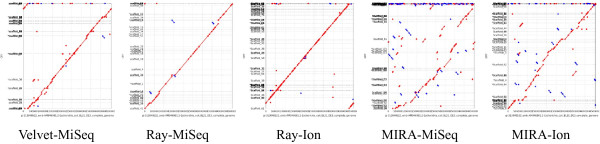
Dot plots of hybrid scaffolding. The assemblies highlighted in Table 1 were scaffolded and gap-filled with varying coverages of PacBio reads. The assembled results with ~100× PacBio coverage were aligned to the reference BL21(DE3) and dot plots were generated. Note the more contiguous assemblies, but with more errors as compared to those in Figure 2.