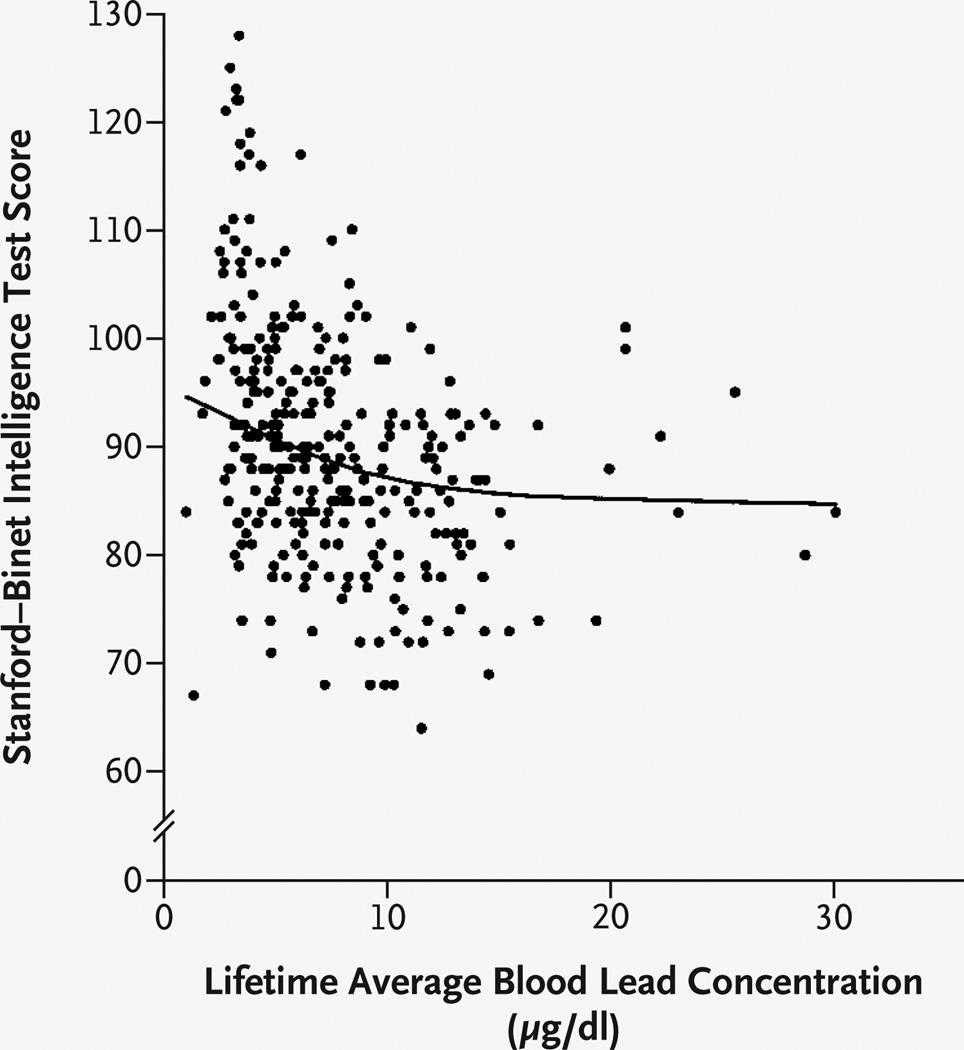
Figure 2. IQ as a Function of Lifetime Average Blood Lead Concentration.
IQ was assessed with use of the Stanford–Binet Intelligence Scale, fourth edition. The line represents the relation between IQ and lifetime average blood lead concentration estimated by the covariate-adjusted penalized-spline mixed model. Individual points are the unadjusted lifetime average blood lead and IQ values. To convert values for lead to micromoles per liter, multiply by 0.0483.

