
Figure 3.
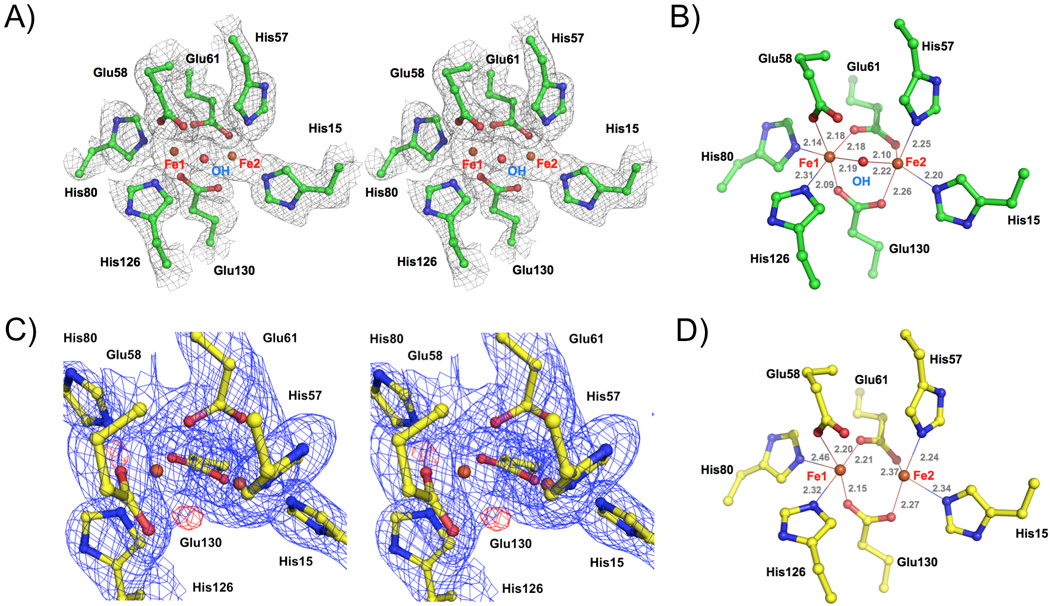
Structure of the diiron center of FBXL5 Hr. A) Stereo view of the experimental (SAD) electron density map of oxidized FBXL5 Hr diiron center. B) Geometry of the oxidized FBXL5 Hr diiron center showing the distances (in Å) between the iron atoms and their ligands. C) Stereo view of the electron density maps of the reduced FBXL5 Hr diiron center. The blue mesh shows the 2Fo − Fc map contoured at 1.1 σ and the red mesh shows the Fo − Fc map contoured at 3.5 σ. D) Geometry of the reduced FBXL5 Hr dirron center.