
Figure 5.
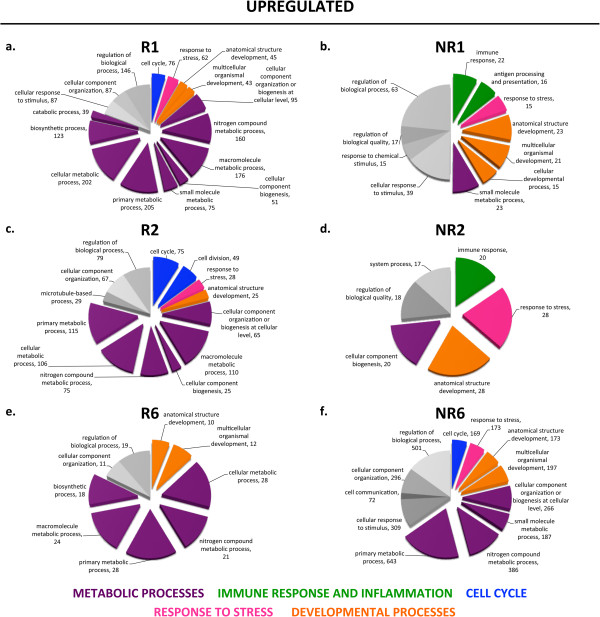
Gene ontology enrichment analysis for upregulated transcripts. Gene ontology (GO) enrichment analysis was performed for transcripts that showed a different response to injury when comparing regenerative and non-regenerative stages for Day 1 (a, b), Day 2 (c, d), and Day 6 (e, f). Colors classify GO terms into the following categories: cell cycle, blue; response to stress, pink; developmental processes, orange; metabolic processes, purple; immune response and inflammation, green; others, grey.