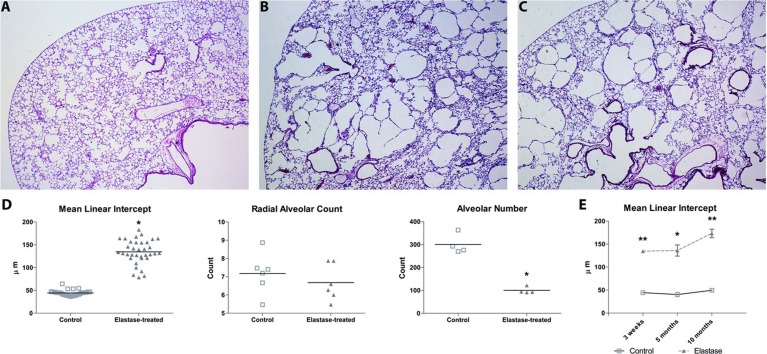
Figure 3. .
Representative histological sections of saline-controls (A), elastase-treated mice 21 days after injection (B) and elastase-treated mice 10 months after elastase injection (C). Sections were stained with hematoxylin and eosin. Morphometry results (D) are expressed as mean ± SEM for both control and elastase-treated group for mean linear intercept (n = 35), radial alveolar counts (n = 6), and alveolar number (n = 4). Morphometry results for 5 and 10 months of recovery in room-air (E) are expressed as mean ± SEM for mean linear intercept (n = 5). * = p < 0.05 ** = p < 0.001.

