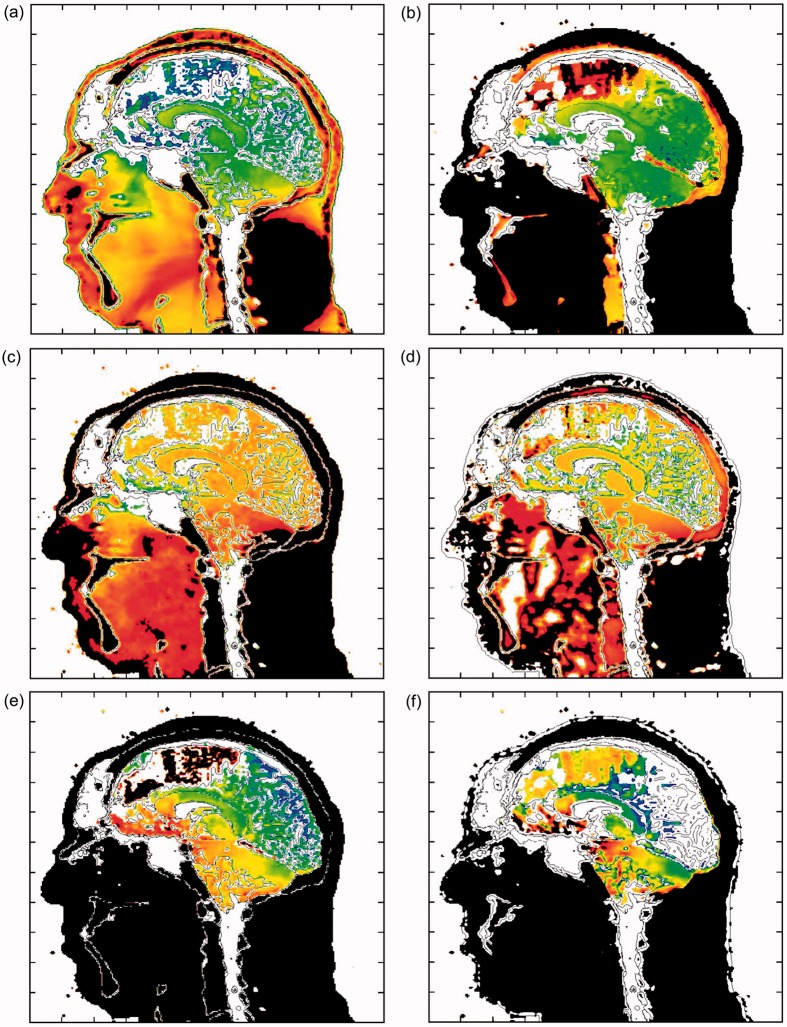
Figure 7.
Plots of maximum stress and energy in the mid-sagittal plane for a 360 KPa frontal blast. (a) Maximum compressive pressure (blue: 0.1 MPa; red: 1 MPa) and (b) corresponding isotropic compressive energy (blue: 1 J/m3; red: 300 J/m3). (c) Maximum tensile pressure (blue: 1 KPa; red: 200 KPa) and (d) corresponding isotropic tensile energy (blue: 1 J/m3; red: 200 J/m3). (e) Maximum deviatoric shear stress (blue: 0.1 KPa; red: 20 KPa) and (f) corresponding deviatoric energy (blue: 1 J/m3; red: 300 J/m3). Plot variable levels increase from blue (minimum), green, yellow, to red (maximum). Black denotes that the plot variable max limit has been exceeded.

