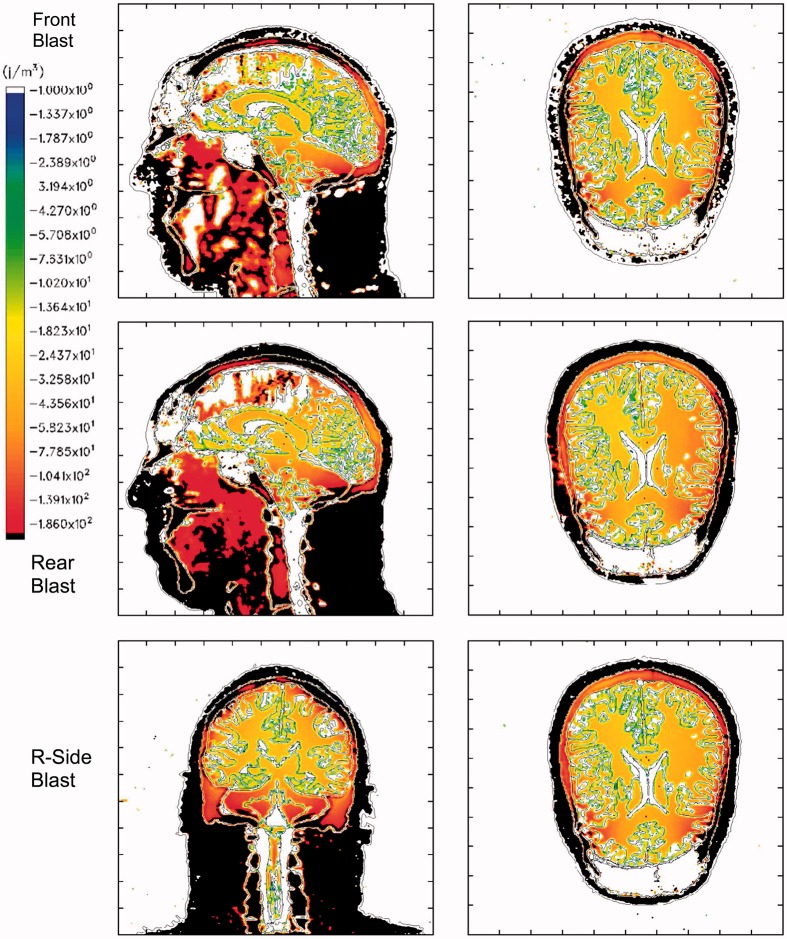
Figure 9.
Maximum Isotropic Tensile Energy for a 360 KPa blast. Top row: Frontal blast, mid-sagittal and axial planes; middle row: rear blast; bottom row: right side blast, midcoronal and axial planes. Color scale: blue: −1 J/m3; red: −200 J/m3; black denotes that the plot limit has been exceeded. Negative energy is associated with tensile loading.

