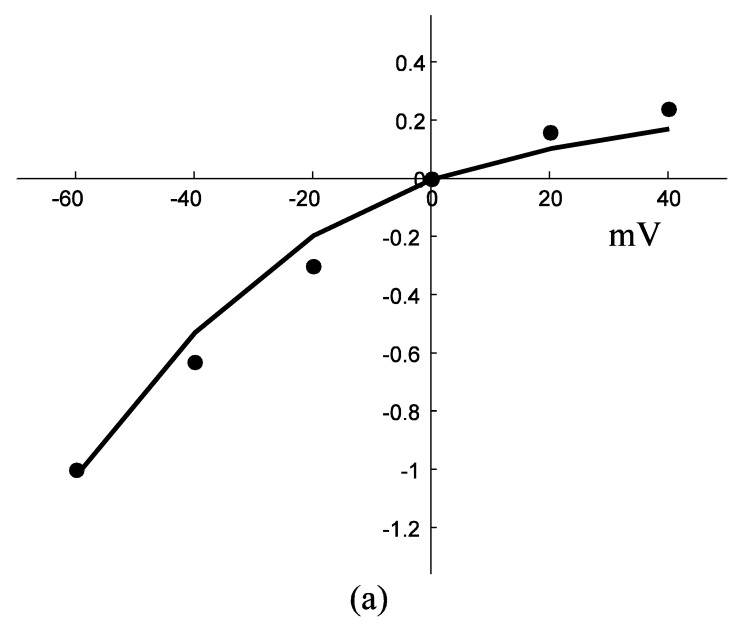
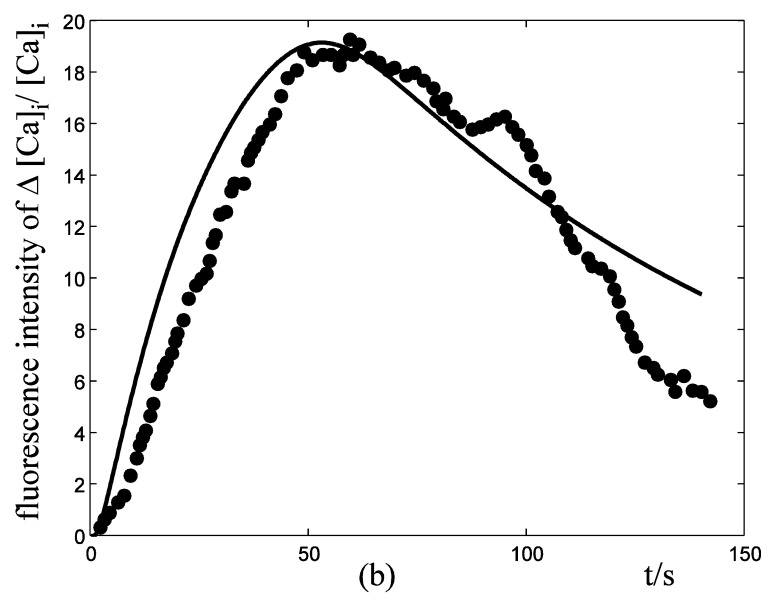
Figure 3.
Response of IATP and [Ca2+]i in a single isolated nerve cell model to ATP stimuli. solid line represents simulation results, filled circles represent the experimental data. (a) sequential current trace of IATP with the cell clamped at different holding potentials ranging from -60 to +40 mV. (b) [Ca2+]i responses after its exposure to an initiating ATP stimuli during time t=0-30s.


