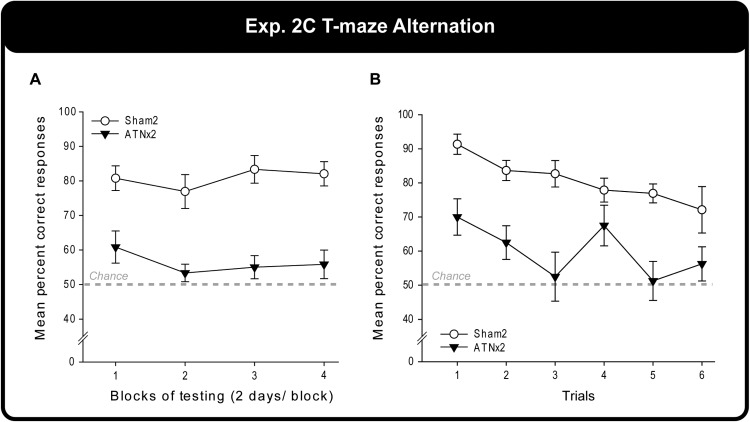
Figure 6.
Experiment 2c – Alternation in a T maze. Graph A shows the percent correct response over successive pairs of training sessions by rats the anterior thalamic lesions (ATNx2) and their controls (Sham2). Graph B shows performance as measured by the position of the trial within each daily sequence (1 = the first trial of each day). Data shown are group means, and the vertical bars are the standard error of the means (SEM).

