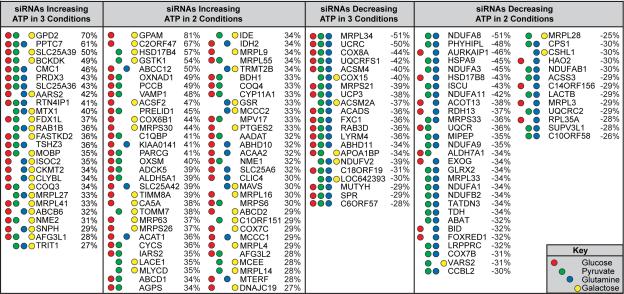
Table 1. Mitochondrial Genes Impacting Cellular Bioenergetics.
Genes altering ATP levels by ≥ 25% in multiple metabolic conditions. Red, green, blue, and yellow circles represent ≥ 25% ATP/cell changes in glucose, pyruvate, glutamine, and galactose conditions, respectively. Percentages are the combined averages of ATP/cell changes in the indicated metabolic conditions.

|
