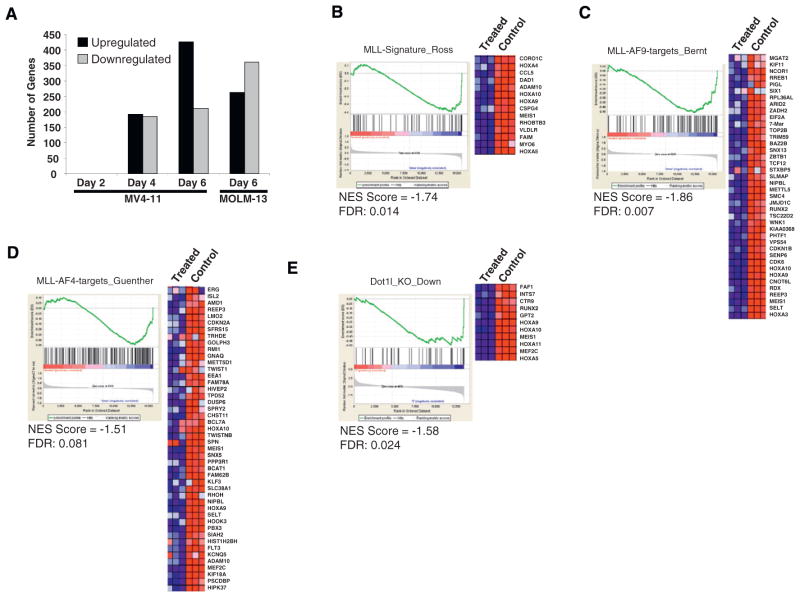
Figure 5. Effect of EPZ004777 Treatment on MLL-Rearranged Gene Expression.
(A) Gene expression changes following treatment of MV4-11 cells with EPZ004777 for 2, 4, or 6 days and MOLM-13 cells for 6 days. Two-group comparison expression data were collapsed to unique gene symbols. Changes in gene expression were filtered by log2 change > 1 or < −1 and by false discovery rate q values < 0.15.
(B) GSEA of genes downregulated by EPZ004777 treatment of MOLM-13 cells as compared with genes overexpressed in MLL-rearranged human acute leukemias (Ross et al., 2004). The heat map shows genes comprising the leading edge of the GSEA plot. Red indicates high expression; blue indicates low expression.
(C) GSEA of genes downregulated by EPZ004777 treatment of MOLM-13 cells as compared with genes bound by MLL-AF9 in MLL-AF9-transformed murine hematopoietic progenitors (see Experimental Procedures and Bernt et al., 2011 [this issue of Cancer Cell]). The heat map shows genes comprising the leading edge of the GSEA plot.
(D) GSEA of genes downregulated by EPZ004777 treatment of MV4-11 cells as compared with genes bound by MLL-AF4 in human SEM cells (Guenther et al., 2008). The heat map shows genes comprising the leading edge of the GSEA plot.
(E) GSEA of genes downregulated by EPZ004777 treatment of MOLM-13 cells as compared with genes downregulated following genetic knockout of Dot1l in a murine MLL-AF9 leukemia model (see Experimental Procedures and Bernt et al., 2011 [this issue of Cancer Cell]). The heat map shows genes comprising the leading edge of the GSEA plot.

