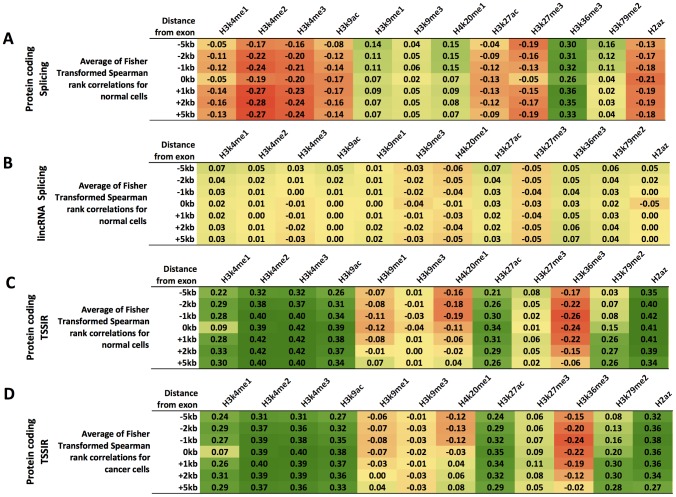
Figure 2. Comparison of epigenetic association between normal and cancer cell lines.
We analyzed (A–C) six normal human cell lines (Gm12878, Hsmm, Huvec, H1hesc, Nhek, Nhlf) and (D) three cancer cell lines (Hepg2, Helas3, K562) for associations between transcription start site inclusion rate and splicing exon inclusion rate and histone modification enrichment for protein-coding genes (A,C, and D) and lincRNAs (B). Values represent the average of Fisher transformed Spearman rank correlations to enable direct comparison. Coefficients are color-coded, with red representing increasingly negative and green representing increasingly positive correlation. Distance from exon categories signifies a region relative to a given exon where histone enrichment was measured; 0 kb represents region within given exon boundaries, and 1 kb, 2 kb, and 5 kb signify regions from the exon boundary either upstream (negative) or downstream (positive).

