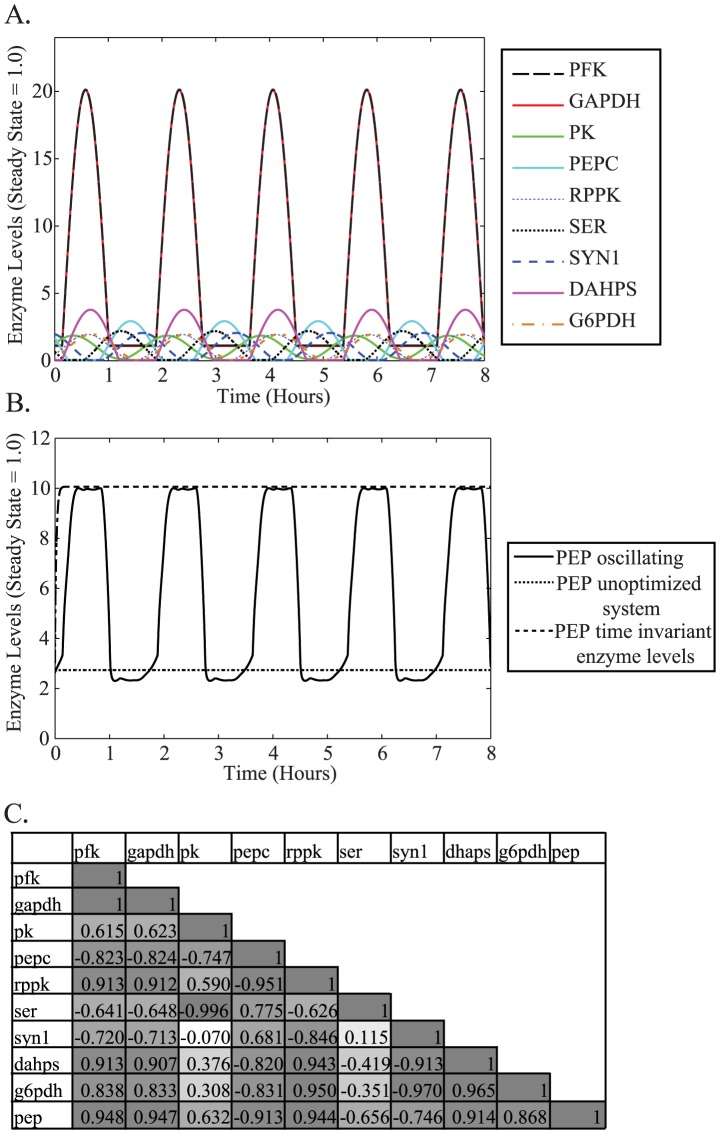
Figure 4. Optimization of PEP-influencing cluster increases intracellular PEP concentration.
A. Resulting profiles from an optimization of enzyme levels with an eight hour time horizon. PFK (black dashes) overlaps with GAPDH (red line), and all the other enzymes appear distinctly within the plot. Enzyme levels are measured as deviations from steady state (1.0). B. Oscillations in PEP levels (black line) resulting from oscillations in enzyme levels. The line with smaller dashes represents the PEP levels without inducing oscillations (unoptimized case). The third line with larger dashes indicates the PEP levels when the levels of enzymes are optimized for PEP production without any oscillations (PEP time invariant enzyme levels). PEP levels are in millimolar. C. Correlation coefficients for the oscillating case shown above. The coefficients are colored using a gray scale with the strongest positive (1) and negative (−1) correlations being darkest and weakest correlations colored lightest.

