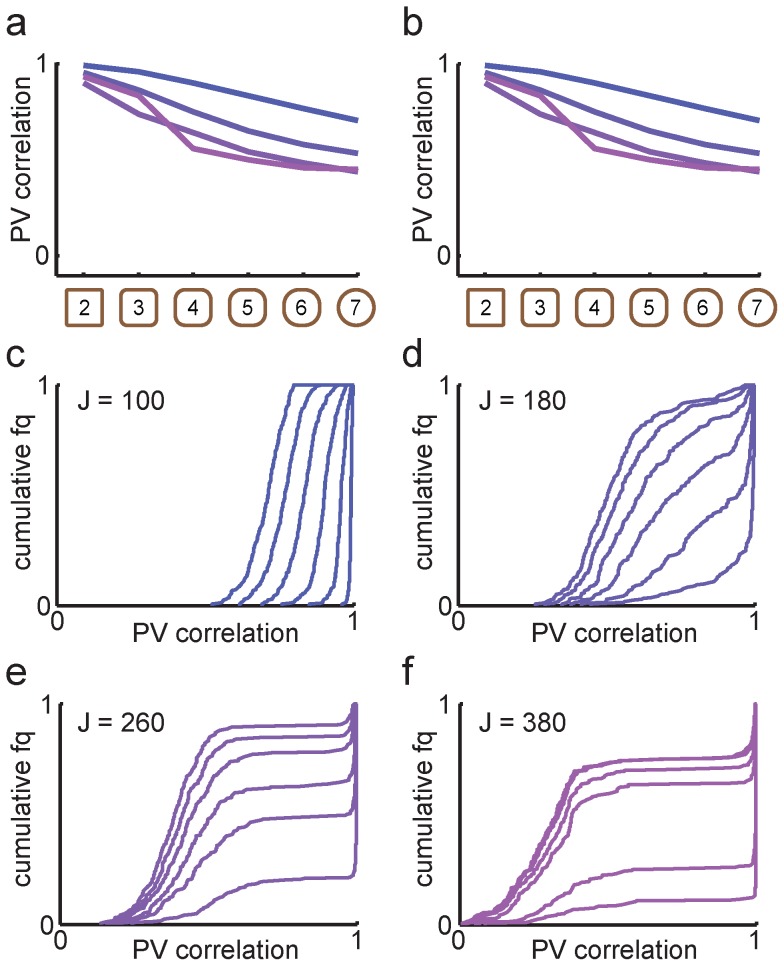
Figure 5. Transition curves in the model with overlapping memories (a = 12) were not shaped by hysteresis.
a, Mean population vector correlation transition curves for different feedback strengths. Increasing J was associated with stronger pattern separation and sharper transition curves. From blue to purple, J = (100, 180, 260, 380). b, To test history dependence of the transition curves, new simulations where network activity was reset between every morph shape were performed. The mean transition curves were not affected by the manipulation. c-f, The CDF curves corresponding to the mean population vector correlations in a qualitatively changed as J increased. For sufficiently strong feedback, sharper transitions could be seen as an asymmetry in how separated the CDF curves were.

