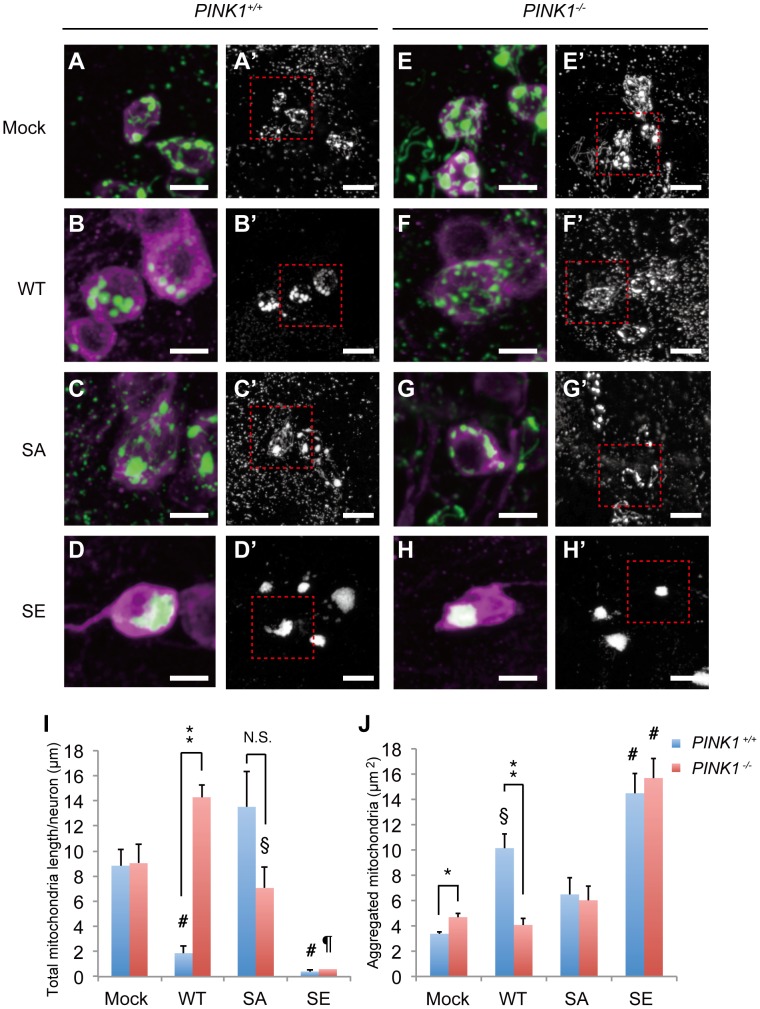
Figure 6. Parkin phosphorylation regulates mitochondrial morphology and the distribution of DA neurons.
Mock (A, A′, E, E′), WT Parkin (B, B′, F, F′), SA Parkin (C, C′, G, G′) or SE Parkin (D, D′, H, H′) were expressed together with mitoGFP in DA neurons of PINK1+/+ (A–D′) or PINK1-/- (E–H′) flies using the TH driver. Mitochondria and cell bodies of the PPM1/2 cluster DA neurons were visualized using mitoGFP (green in A–H and white in A′–H′) and anti-TH staining (magenta in A–H), respectively. Images (A–H) are higher magnifications of the boxes shown in (A′–H′). Scale bars = 5 µm in (A–H) and 10 µm in (A′–H′). (i) Graph showing the total lengths of mitochondria observed in the cell bodies. # p<0.05 vs. mock in PINK1+/+, § p<0.05 vs. WT or SE in PINK1-/-, ¶ p<0.05 vs. all other genotypes in PINK1-/-, ** p<0.01, N.S., not significant. (j) Graph showing the mean areas of aggregated mitochondria greater than 3 µm in each genotype. # p<0.05 vs. all other genotypes in PINK1+/+ or PINK1-/-, § p<0.05 vs. mock in PINK1+/+. ** p<0.001, * p<0.05 (Student's t-test).

