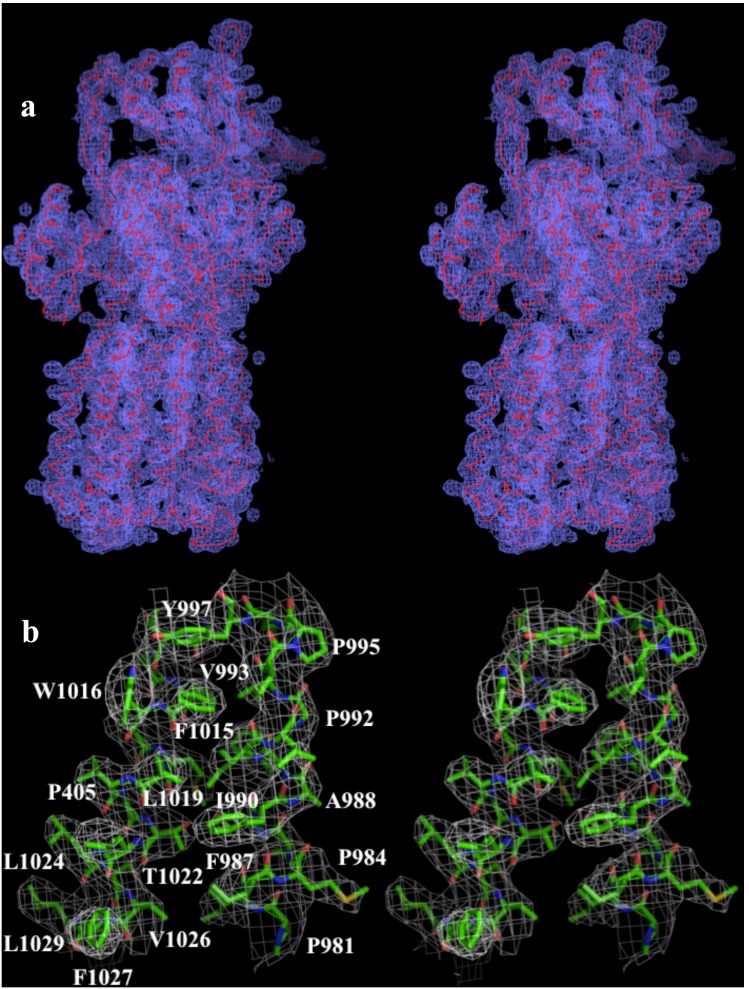
Figure 1. Stereo view of the electron density map of the MtrD efflux pump at a resolution of 3.53 Å.
(a) The electron density map contoured at 1.2 σ is in blue. The Cα traces of MtrD are in red. (b) Representative section of the electron density at the interface between TM11 and TM12 of MtrD. The electron density (colored white) is contoured at the 1.2 σ level and superimposed with the final refined model (green, carbon; red, oxygen; blue, nitrogen).

