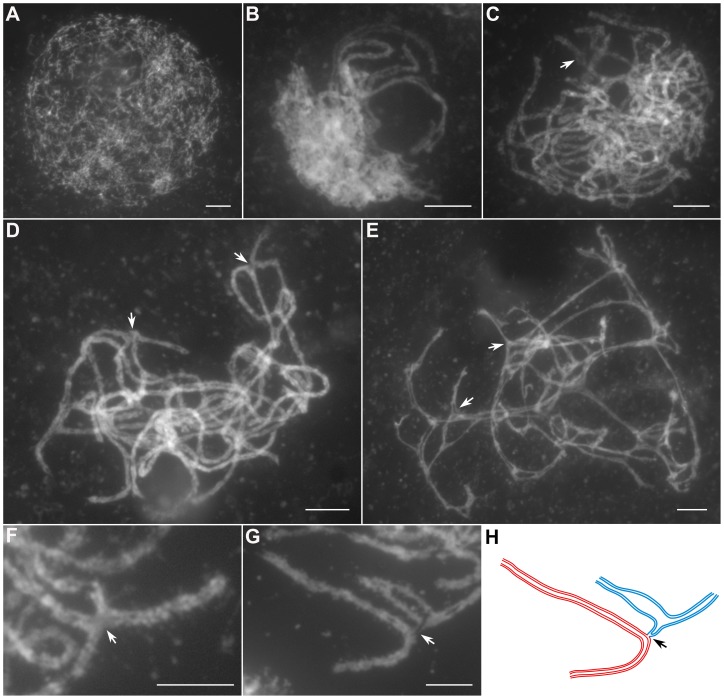
Figure 2. Meiotic chromosome behaviors of PMCs in the Oshus1-1 mutant.
(A) Leptotene. (B) Zygotene. (C) Early pachytene. (D) Middle pachytene. (E) Late pachytene. (F, G) The enlarged chromosome ectopic association regions. (H) Diagram shows chromosome configuration in (G). Red and blue lines indicate sister chromatids in different bivalents. The arrow indicates “bubble-like” region in (C) and ectopic association site in (D–H). Bars, 5 µm.

