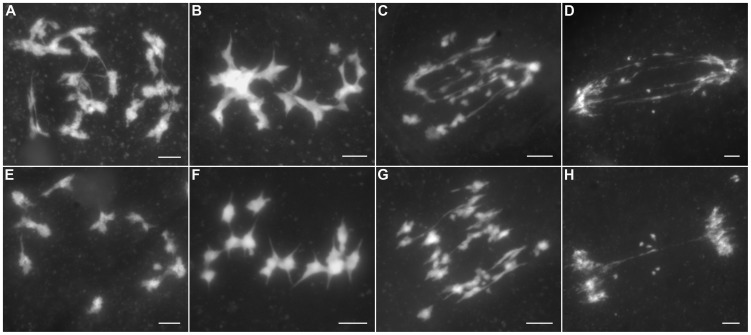
Figure 3. The aberrant chromosomal interactions in Oshus1-1 resulted in multivalent associations and chromosome fragments.
(A–D) exhibit PMCs with high frequencies of ectopic chromosomal interactions, while (E–H) show PMCs with low levels of ER. (A, E) Diakinesis. (B, F) Metaphase I. (C, G) Anaphase I. (D, H) Telophase I. Bars, 5 µm.

