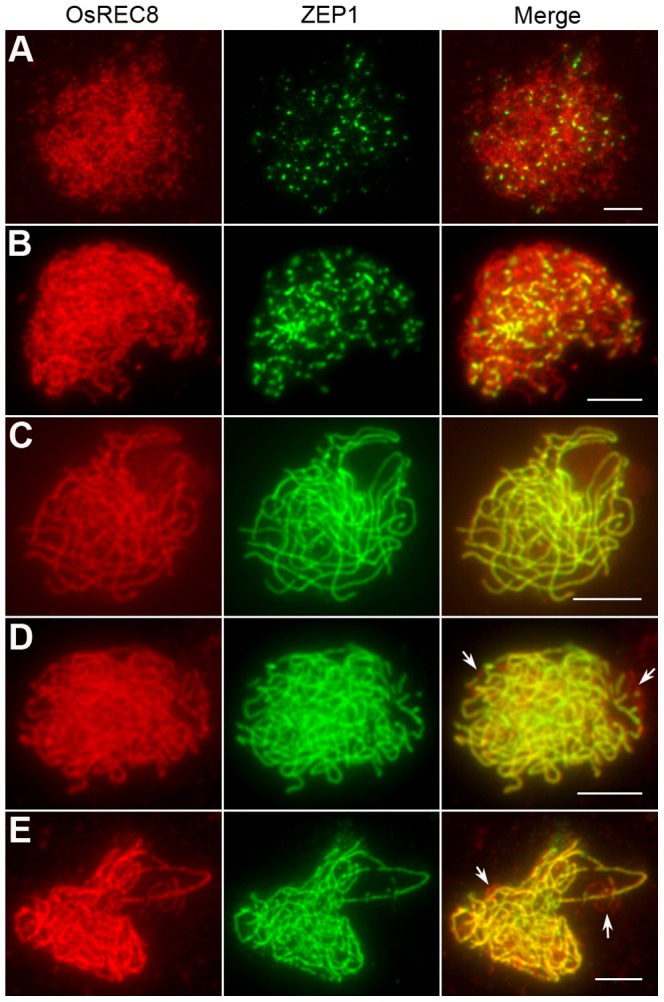
Figure 4. Immunolocalization of ZEP1 in the Oshus1-1 mutant.

(A) Leptotene. (B) Zygotene. (C–E) Pachytene. Image (C) shows complete ZEP1 signals along the meiotic chromosomes in the pachytene PMC, while (D) and (E) exhibit discontinuities of ZEP1 linear signals. Arrows indicate these gaps. Bars, 5 µm.
