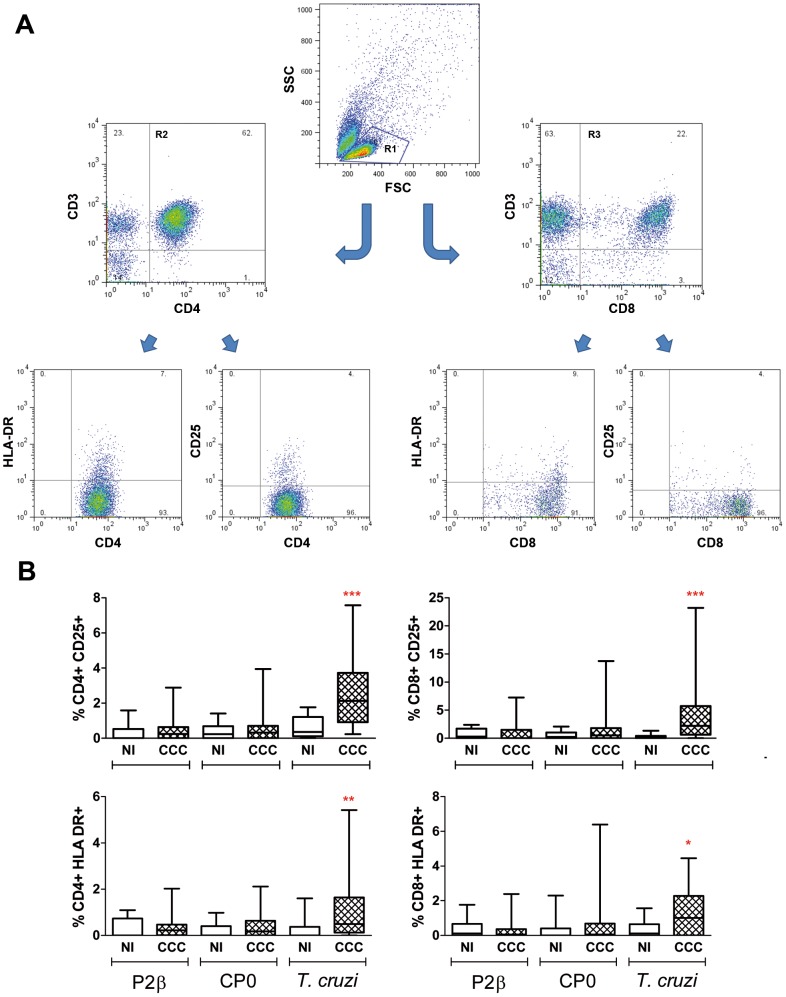
Figure 3. Activation markers on CD4+ and CD8+ T cell subsets upon T. cruzi and ribosomal protein activation.
PBMC isolated from patients with chronic Chagas' disease Cardiomyopathy (CCC; n = 27) and non-infected individuals (NI; n = 20) were seeded at 2.5×10⁶ cells/well and stimulated with T. cruzi lysate, P2β or CP0 proteins (10 µg/ml) or medium alone for 6 days. PBMC were stained with CD3-APC, CD4-PE-Cy5 or CD8-PE-Cy5 and activation marker-specific labeled antibodies (CD25-FITC and HLA-DR-PE) prior to flow cytometry analysis. 10,000–15,000 events in the lymphocyte gate (R1 gate) were acquired using a FACSAria flow cytometer (Becton Dickinson); dead cells were excluded by forward vs side-scatter (FSC/SSC) gating. A) Gate-pathway used to determine the activation expression in the populations graphed in B. B) Results were expressed as the percentage of CD25+ or HLA-DR+ cells in CD3+CD4+ (R2 gate) or CD3+CD8+ (R3 gate) lymphocytes. Horizontal lines represent the median and percentiles 25–75th, vertical lines represent percentiles 5–95th. Statistical analysis was performed using the Mann-Whitney U Test, ***P<0.001, **P<0.01, *P<0.05.

