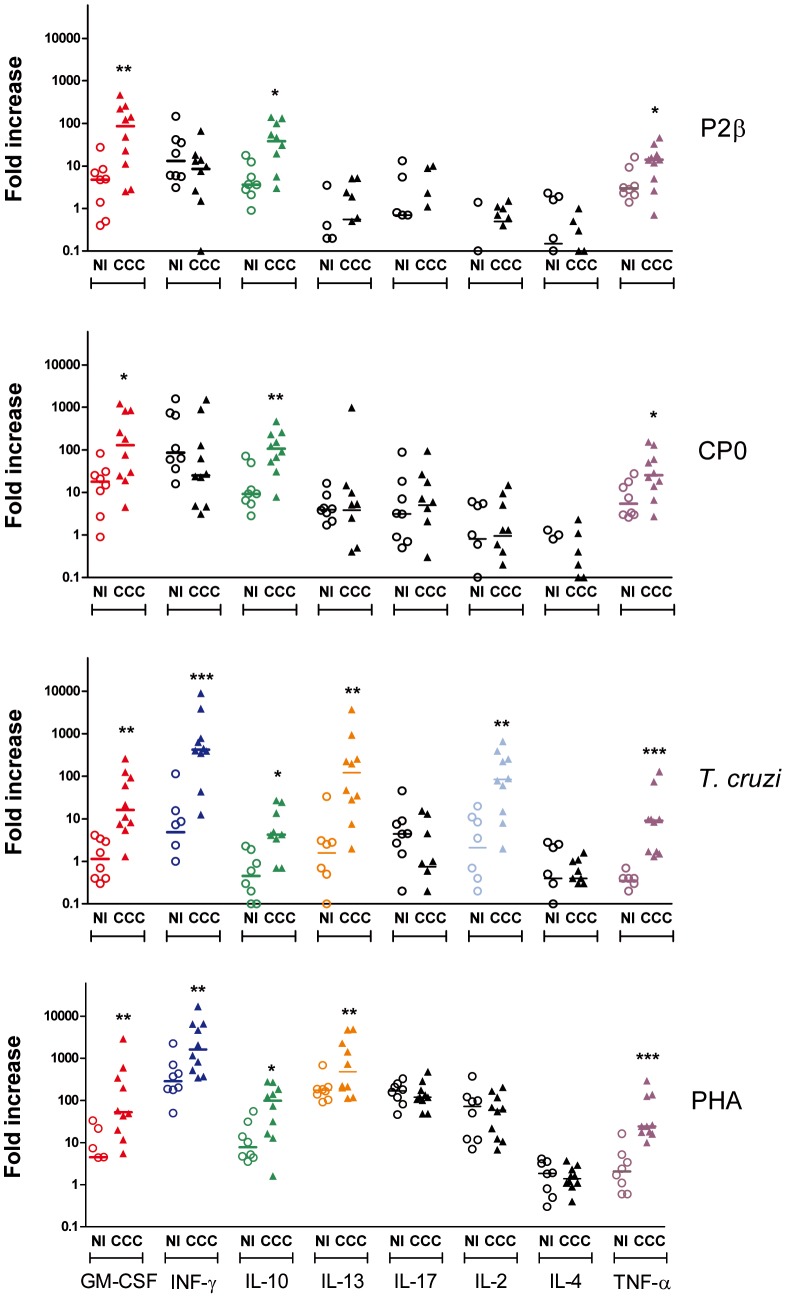
Figure 4. Cytokine expression in PBMC from chagasic patients after in vitro stimulation.
PBMC isolated from patients with chronic Chagas' disease Cardiomyopathy (CCC; n = 10) and non-infected individuals (NI; n = 8) were cultured in the presence of the indicated stimulus. Supernatants were collected on days 1, 2 and 6 and cytokines were quantified by multiplex technology. The Fold increase (FI) was calculated as: [(cytokine in stimulated culture) - (cytokine in NS culture)]/(cytokine in NS culture), where NS denotes non-stimulated cultured PBMC. The maximum FI out of the 3 day-determinations for each subject and for each cytokine are shown. In color are denoted the cytokines for which the FI in the CCC patients were statistically significantly higher than in non-infected individuals. Each symbol represents data from a single subject. Statistical analysis was performed using the Mann-Whitney U Test, ***P<0.001, **P<0.01, *P<0.05.

