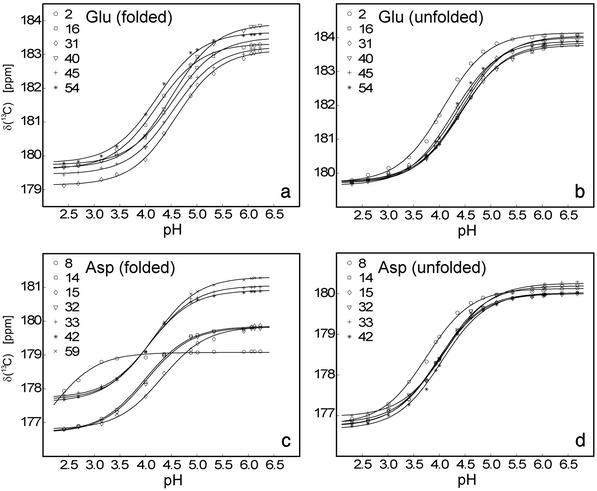
Fig 1.
Experimental titration curves (carboxyl carbon chemical shifts vs. pH) obtained for glutamate and aspartate side-chain acidic groups in the folded (a and c) and unfolded (b and d) states of the drkN SH3 domain, including best-fit lines (see Methods). Best-fit pKa values are given in Fig. 2c.

