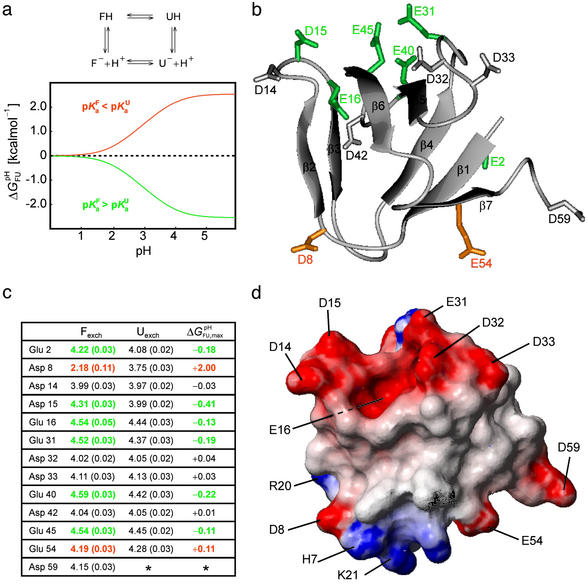
Fig 2.
Analysis of the pH dependence of ΔGFU. (a) Simulation of ΔG (i) for a single ionizable group that titrates with (i) pK
 = 2.0 and pK
 = 4.0, orange line, (ii) pK
 = 4.0 and pK
 = 2.0, green line, and (iii) pK
 = pK
= pK , dashed black line, at 278 K. (b) The folded state structure of the drkN SH3 domain. Asp and Glu side-chains are color-coded (if |ΔG
 (i)| > 0.1 kcal⋅mol−1) according to whether pK
 < pK
< pK (orange) or pK
 < pK
< pK (green). (c) Experimental side-chain carboxyl pKa values and error estimates (in parentheses) for Asp and Glu in the Fexch and Uexch states and ΔG
 (i) values. The pKa values for the side-chain of Asp-59 in the unfolded state (*) could not be obtained due to resonance overlap. (d) Surface electrostatic potential of the drkN SH3 domain at neutral pH, identical view as b. Red represents negative electrostatic potential, white is neutral, and blue represents positive electrostatic potential. (b and d) Diagrams were generated by using the program MOLMOL (38).

