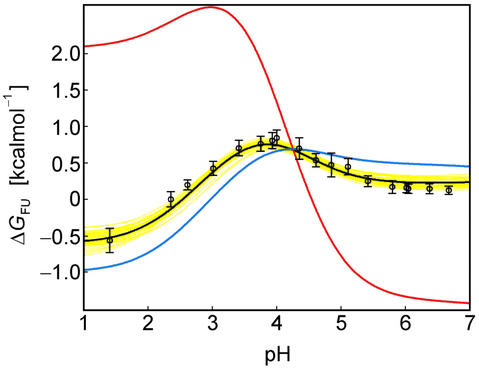
Fig 3.
The pH dependence of protein stability of the drkN SH3 domain between pH 1 and pH 7. Experimentally determined values of ΔGFU (black circles) were determined as ΔGFU = −RT ln(pU/pF), where pU and pF are fractional populations as measured from peak volumes of the Uexch and Fexch states in heteronuclear single quantum coherence experiments and error bars represent SD. The calculated pH dependence of ΔGFU (black line) was derived by using experimental, residue-specific pKa values for both states employing Eqs. 2 and 3. The vertical offset of the calculated curve, ΔG , was determined by minimizing the χ2 with the experimental data. A Monte Carlo simulation was performed by normally distributing pKa values within their SD as estimated from experimental uncertainties (yellow lines). For comparison, pH stability profiles representing simplified models for the unfolded state are plotted assuming (i) standard pKa values (blue line) and (ii) general downward shifted pKa values (by 0.3 pH units from standard values, red line) for the unfolded state but by using experimental pKa values for the folded state.

