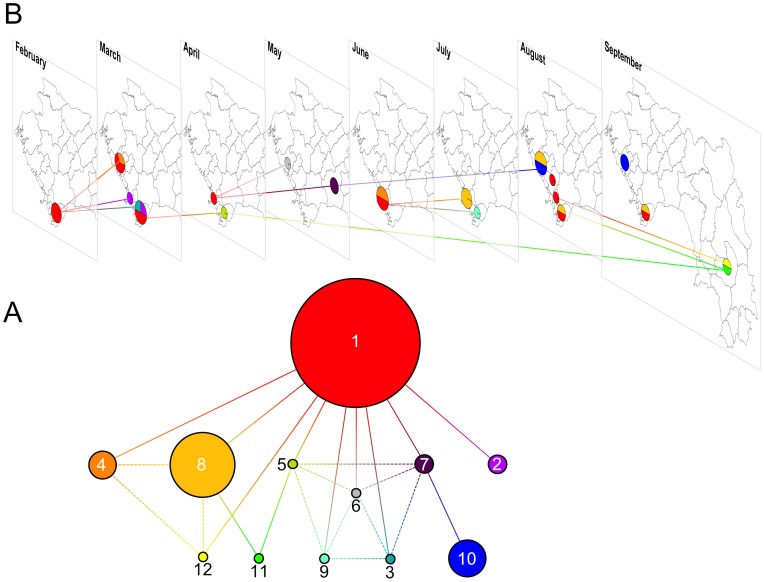
Figure 4. MLVA-based genotypes and relatedness of 38 clinical V. cholerae strains isolated in Guinea in 2012.
(A) Network of V. cholerae strain relatedness based on MLVA genotype. Following the genotype analysis of 38 V. cholerae strains using 6 different microsatellite loci, the strains were grouped according to the resulting MLVA genotype profiles. Each colored circle corresponds to a different genotype. The numbers indicate the sequential order when the first strain of the corresponding genotype was isolated. Circle diameter is relatively proportional to the number of isolates represented by each genotype (e.g., 14 strains displayed genotype #1, 7 isolates displayed genotype #8 and 1 strain displayed genotype #3). Each segment corresponds to a single mutation at 1 of the 6 assessed VNTRs. Bold segments represent primary and likely relatedness links between genotypes, while the dashed segments represent secondary and less likely genetic relationships. Genotype #1 was identified as the founder genotype using the eBURST algorithm. (B) Spatiotemporal repartition of genotyped V. cholerae strains. Prefecture-level maps of Guinea are displayed for each month from February to September 2012. The genotype color code described in Figure 4A was applied to spatially and temporarily localize the isolated strains. Therefore, the pie charts reflect the month and prefecture of strain isolation (represented by strain genotype) as well as the relative proportion of each genotype among them. Segments between different months spatially and temporarily illustrate the genetic relatedness displayed in Figure 4A. Only primary and sequentially earliest links between genotypes are represented.

