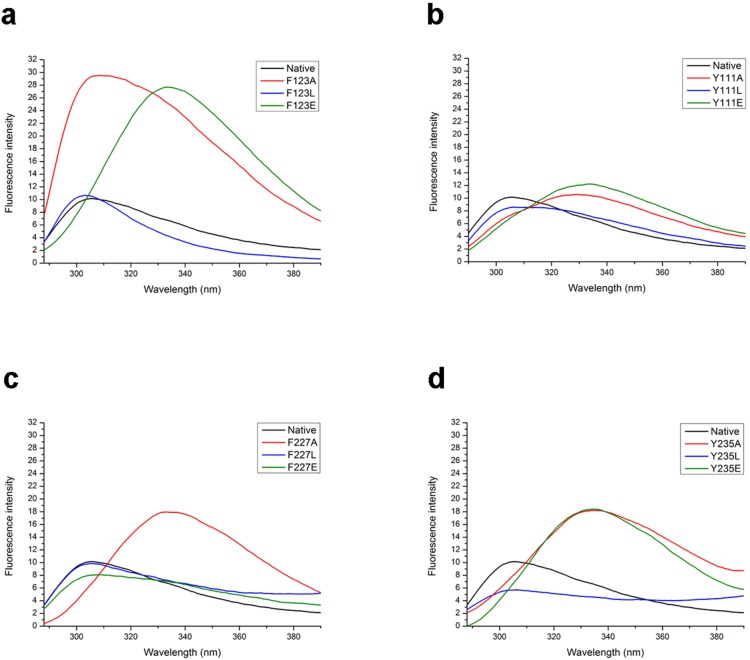
Figure 8. Fluorescence scans of wild-type SiaM and the mutants.
Fluorescence scans were used to monitor the tertiary structures of SiaM and its mutants. The fluorescence intensity is shown in arbitrary units. (a) Spectra of the mutants at F123. (b) Spectra of the mutants at Y111. (c) Spectra of the mutants at F227. (d) Spectra of the mutants at Y235.

