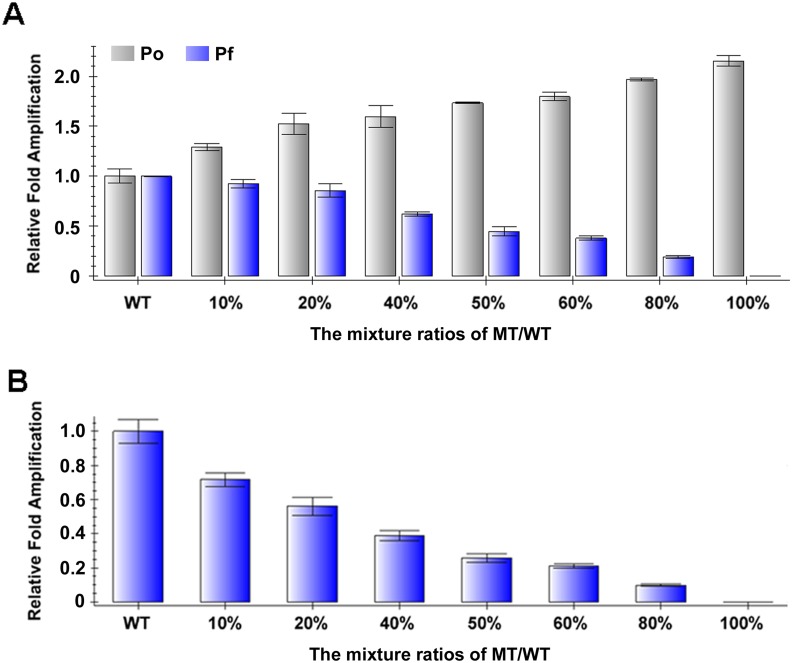
Figure 2. Determination of known mutations with qPCR.
(A) Relative levels of Po or Pf PCR products. The amounts of Po or Pf PCR products of mixed templates were compared to the amount of corresponding PCR products of pure wild-type template. (B) Relative ratios between Po PCR products and Pf PCR products. The ratios between Po PCR products and Pf PCR products of mixed templates were compared to the ratio of wild-type template. WT, wild-type. MT, mutant.

