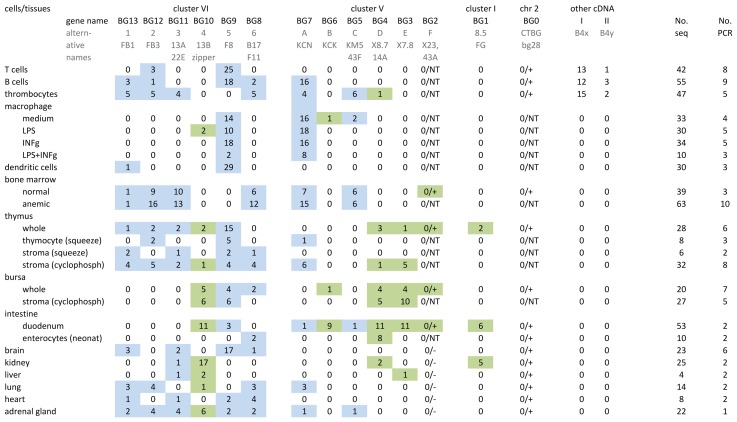
Figure 2. Individual BG genes of the B12 haplotype have striking expression patterns, as assessed by RT-PCR from cells and tissues using what were expected to be “universal primers” followed by cloning and sequencing.
At the top, the heading of columns indicates the genes (with their present names along with alternative names previously used) in the same orientation as in Figure 1, and sequences labelled I and II apparently picked up from the B4 haplotype during derivation of CB congenic line chickens from the B12 haplotype of C line chickens. Also shown are the number of independent PCR reactions, and the number of total BG clones sequenced. On the left, the labels for rows describe the isolated cells and tissues from which the RNA was derived, along with separation techniques and treatments that were carried out (as described in Materials and Methods). Values in the table indicate the number of sequences found by RT-PCR, cloning and sequencing for each gene. After the work was well underway, it was realised that the primers were not “universal”, and therefore presence and absence of BG0 and BG2 were determined by specific primers (designated by a number for the sequences, followed by a plus or minus); NT indicates not tested. The coloured boxes indicate the results for presumed haemopoietic (blue) and tissue (green) genes. To be clear, complete separation of these expression patterns in tissues is not expected: all tissues contain blood vessels, some tissues contain tissue-resident macrophages and some tissues contain primary or secondary lymphoid tissue.

